The above figure shows Larry's indifference map and budget lines for ham and pork. Which of the following statements is TRUE?
A) Pork is an inferior good.
B) Ham is an inferior good.
C) Neither pork nor ham is an inferior good.
D) Both ham and pork are inferior goods.
B
You might also like to view...
The Bureau of Labor Statistics does not try to account for quality changes in the goods and services in the basket used to compute the CPI
a. True b. False Indicate whether the statement is true or false
If the demand curve in graph B shifts to the left, which of the following most likely happened in Graph A?
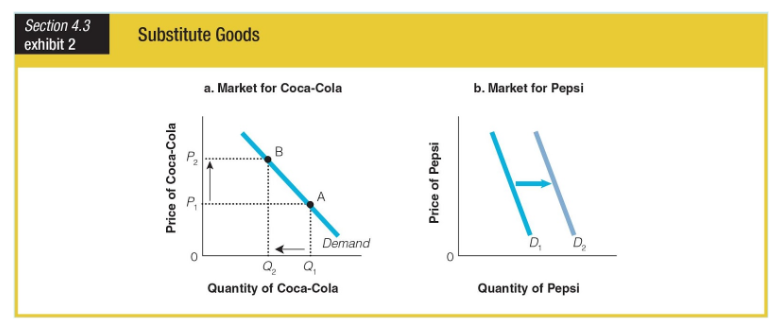
a. Point A changed to Q1.
b. Q1 changed to Q2.
c. Point A changed to Point B.
d. P2 changed to P1.

The most accurate measurement of unemployment
a) is an extrapolation based on a random survey of households b) counts the number of workers collecting unemployment insurance benefits c) uses payroll data by subtracting the number of workers employed at firms from the number of citizens of working age d) uses the number of layoffs reported to the government by employers e) none of the above