Sketch the graph and show all local extrema and inflection points.f(x) = 
A. Local minimum: (1, -3)
Local maximum: (-1, 3)
Inflection point: (0, 0)
B. Maximum: (0, 6)
No inflection point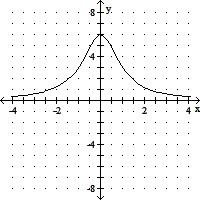
C. Local minimum: (-1, -  )
)
Local maximum: (1,  )
)
Inflection point: (0, 0)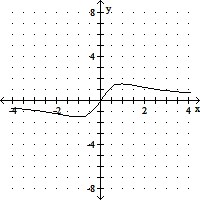
D. Local minimum: (-1, -3)
Local maximum: (1, 3)
Inflection points: (0, 0), (-1 , -
, - 
 ),
),
(1 ,
, 
 )
)
Answer: D
You might also like to view...
Solve the system of equations using substitution.
A. x = -5, y = -1; x = 8, y = 
or (-5, -1), 
B. x = 5, y = 1; x = -8, y = - 
or (5, 1), 
C. x = 5, y = 1; x = -  , y = -8
or (5, 1), 
D. x = -5, y = -1; x =  , y = 8
or (-5, -1), 
The wind-chill index I is the perceived temperature when the actual temperature is T and the wind speed is v so we can write I = (T, v). The following table of values is an excerpt from a table compiled by the National Atmospheric and Oceanic Administration. Use the table to find a linear approximation L(T, v) to the wind chill index function when T is near 16°C and v is near 30 kmh.
 figures 4.png)
Use the order of operations to evaluate each problem.72 ÷ 7 ? 5 + 1
A. 28 B. 35 C. 36 D. 34
Solve the problem.If the probability that an identified hurricane will make a direct hit on a certain stretch of beach is  , what are the odds against a direct hit?
A. 4 to 1 B. 2 to 1 C. 3 to 1 D. 1 to 4