Renoir Associates had the following inventory data:
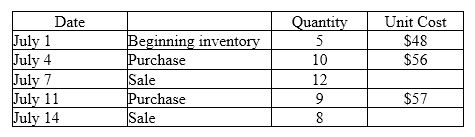
Assuming FIFO, what is the cost of goods sold for the July 14 sale? (Round any intermediary calculations to the nearest cent and your final answer to the nearest dollar.)
A) $453
B) $448
C) $454
D) $456
A) $453
Explanation: (unit cost July 4 × 3) + (unit cost July 11 × 5). Ex: ($56 × 3) + ($57 × 5) = $453
You might also like to view...
Which combines all of the elements of e-commerce, Internet marketing, and mobile marketing?
A) e-mail B) Web 2.0 C) Web analytics D) digital marketing
If input and processing controls are adequate, why are output controls needed?
In the promotion blend during the market maturity stage of the product life cycle,
A. the basic promotion objective is informing. B. the promotion emphasis starts to shift from building primary demand to building selective demand. C. the total amount spent on promotion may rise as competition increases. D. the total amount spent on promotion usually decreases. E. None of these answers is correct.
A graphical presentation of a frequency distribution, relative frequency distribution, or percent frequency distribution of quantitative data constructed by placing the class intervals on the horizontal axis and the frequencies on the vertical axis is a _____
a. histogram b. bar chart c. stem-and-leaf display d. pie chart