Refer to the graph shown. What distance represents average profits?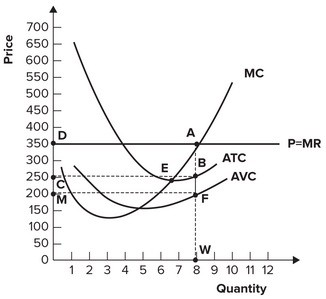
A. BF
B. AB
C. FW
D. AF
Answer: B
You might also like to view...
What information does the government need to support an assertion that the 20-unit abatement standard is allocatively efficient?
Assume that there are two firms, each emitting 20 units of pollutants into the environment, for a total of 40 units in their region. The government sets an aggregate abatement standard (AST) of 20 units. The polluters' cost functions are as follows, where the dollar values are in thousands: Polluter 1: TAC1 = 10 + 0.75(A1)2, Polluter 2: TAC2 = 5 + 0.5(A2)2, MAC1 = 1.5A1, MAC2 = A2.
In Figure 3-7 above, the marginal propensity to save is
A) 1. B) 5. C) 0.5. D) 0.2.
Labor productivity growth in the United States during the 1973–1995 period could be explained by a ____ slowdown.
A. labor force B. capital formation C. technological D. population growth
When the economy fluctuates around its long-run aggregate supply:
A. it is called the business cycle. B. the value of currency becomes unstable. C. we must be in a recession. D. the economy is in a state of chaos.