According to the graph shown, at point C the firm is earning:
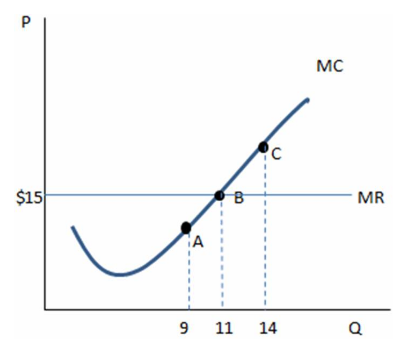
A. higher profits than at point B, and they should produce more.
B. fewer profits than at point B, and they should produce more.
C. fewer profits than at point B, and they should produce less.
D. higher profits than at point B, and they should produce less.
C. fewer profits than at point B, and they should produce less.
You might also like to view...
Refer to Figure 13-14. Which of the following statements describes the firm depicted in the diagram?
A) The firm is making no economic profit and will exit the industry. B) The firm is in long-run equilibrium and is breaking even. C) The firm is suffering an economic loss by producing at Q0 but will break even if it increases its output to Q1. D) The firm achieves productive efficiency by producing at Q0.
During the past several decades, foreign aid to sub-Saharan Africa
a. has been smaller than the aid to other regions, but the reduction in the extreme poverty rate has been larger in Africa than in other areas of the world. b. has been larger than the aid to other regions, but the reduction in the extreme poverty rate has been smaller in Africa than in other areas of the world. c. has declined and as a result the poverty rate in sub-Saharan Africa has risen sharply. d. has risen and, as a result, the poverty rate in sub-Saharan Africa has declined substantially.
When the housing bubble popped, the effect of the negative demand side shock and the negative supply side shock were the same on:
A. output, causing it to definitely decrease. B. prices, causing them to definitely rise. C. output, causing it to definitely increase. D. prices, causing them to definitely fall.
A major advantage of the corporate form of business organization is the concept of limited liability.
Answer the following statement true (T) or false (F)