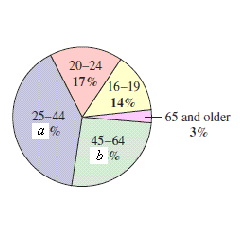
There were approximately 42 million unemployed workers in the United States. The circle graph shows the age profile of these unemployed workers. What is the probability that a person selected at random from the population of unemployed workers is 45 or older? ( and
and 
varid="variable_id_field" variablename="impvar_1b2a3f41c4804de597e2e4c7d" />)
?
?
A. 
B. 
C. 
D. 
E. 42
Answer: B
Mathematics
You might also like to view...
Write an equivalent double integral with the order of integration reversed.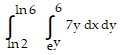
A. 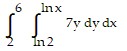
B. 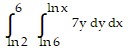
C. 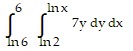
D. 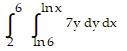
Mathematics
Identify the function represented by the power series.
A. f(x) = 
B. f(x) = 
C. f(x) = 
D. f(x) = 
Mathematics
Find the probability.A card is drawn from a well-shuffled deck of 52 cards. What is the probability of drawing a face card or a 3?
A. 
B. 
C. 16
D. 
Mathematics
Find the product or quotient, using trigonometric form. Write the answer in the form a + bi.(3 - 4i)(8 + 8i)
A. -8 - 56i B. -32i2 - 8i + 24 C. 56 - 8i D. 56 + 8i
Mathematics