Use the following diagrams for the U.S. economy to answer the next question.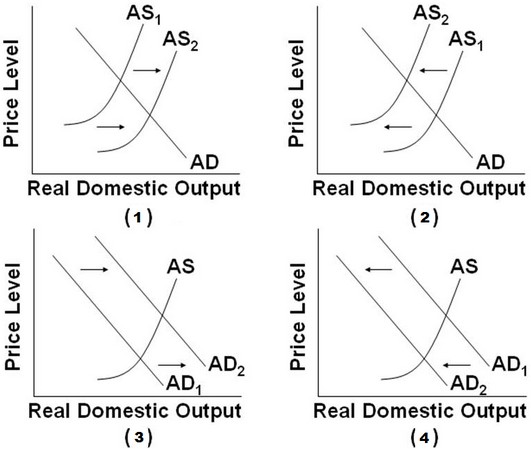 Which of the diagrams best portrays an expansion?
A. Graphs (1) and (2)
B. Graphs (1) and (3)
C. Graphs (2) and (4)
D. Graphs (3) and (4)
Answer: B
You might also like to view...
A change in all of the following variables will change the market demand for a product except
A) the price of the product. B) tastes. C) income. D) population and demographics.
Refer to Table 4-6. The table above lists the marginal cost of polo shirts by Marko's, a firm that specializes in producing men's clothing. If the price of polo shirts decreases from $15 to $10
A) there will be a shortage of polo shirts. B) producer surplus will fall from $13 to $3. C) the marginal cost of producing the third polo shirt will increase to $25. D) consumers will buy no polo shirts.
Let the production function be q = ALaKb. Returns to scale are equal to
A) a ? b. B) a + b. C) La + Kb. D) A ? L.
Table 36-1Suppose the economy of Macroland is described by the following:C = 200 + 0.8 DI (DI = disposable income)I = 300 + 0.2Y?50r (Y = GDP)(r, the interest rate, is measured in percentage points. For example, a 9 percent interest rate is r = 9).For this economy, assume that the Federal Reserve uses its monetary policy to peg the interest rate atr = 5G = 750T = 0.25YX = 200M = 150 + 0.2YHint: DI = Y?T From Table 36-1, find the budget deficit or surplus for Macroland.
A. 125.50 B. ?93.75 C. ?126.25 D. ?154.75