The graph below shows the number of students enrolled in various courses at State University in spring 2000. Each bar represents a different course, and the height of the bar represents the number of students enrolled. Use the graph to answer the question.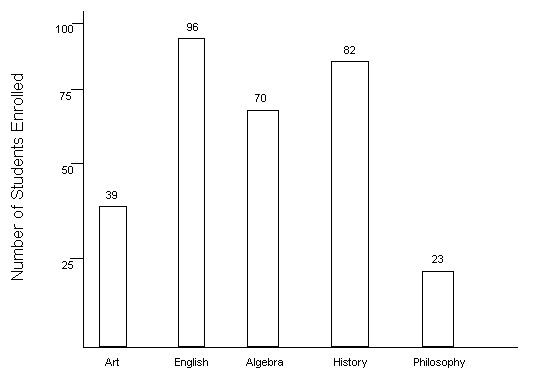 For which courses was enrollment greater than 80?
A. English and Algebra
B. English and History
C. English, Algebra, and History
D. English
Answer: B
You might also like to view...
Solve.A window is in the shape of a square topped by a semicircle. The side of the square is x cm and the window cannot be wider than 160 cm. Find the function for the area of the window and the domain of the function.
A. A = x2 +  ?x2 : 0 < x ? 160
B. A = x2 +  ?
? 2 : 0 < x ? 1602 +
  ?
? 2
2
C. A = 4x2 +  ?x2 : 0 < x ? 160
D. A = x2 +  ?
? 2 : 0 < x ? 160
Tell whether the angle is acute, right, obtuse, or straight.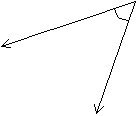
A. Straight B. Obtuse C. Acute D. Right
Solve the problem.The total sales in dollars of some small businesses fluctuates according to the equation  where x is the time in months, with x = 1 corresponding to January,
  and
and  Determine the month with the greatest total sales and give the sales in that month.
A. March; $10,700 B. September; $2700 C. June; $6700 D. December; $10,700
Subtract.(7w4 - 8wz + 6wz2) - (4w4 + 3wz - 7wz2)
A. 11w4 + 11wz + 13wz2 B. 3w8 - 11w2z2 + 13w2z4 C. 3w4 - 11wz + 13wz2 D. 3w4 - 11w2z2 + 13wz2