Exhibit 10-12 Income distribution for three countries
QuintileCountry I (%)
Country II (%)
Country III (%)
Poorest 6
8
4
Second12
12
8
Third15
15
10
Fourth27
30
30
Richest40
35
48
Exhibit 10-12 shows the percentage of income received by each population quintile. From this chart we can conclude:
A. Country I has the most unequal income distribution.
B. Country III has a more equal income distribution than Country II.
C. Country II has the most unequal income distribution.
D. Country II has the most equal income distribution.
Answer: D
You might also like to view...
How does elasticity of supply differ for a product that can be stored, compared to a product that cannot be stored?
What will be an ideal response?
The measure of the aggregate price level that is most frequently reported in the media is the
A) GDP deflator. B) producer price index. C) consumer price index. D) household price index.
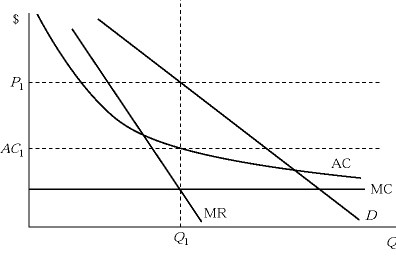 Figure 11.1Profits for the monopolistically competitive firm depicted in Figure 11.1:
A. will increase in the long run. B. will not change in the long run. C. will decrease in the long run. D. are impossible to predict in the long run.
The natural rate of unemployment is the rate of unemployment
A) that occurs when the money market is in equilibrium. B) that occurs when the markup of prices over costs is zero. C) where the markup of prices over costs is equal to its historical value. D) that occurs when both the goods and financial markets are in equilibrium. E) none of the above