Plot and interpret the appropriate scatter diagram.The one-day temperatures for 12 world cities along with their latitudes are shown in the table below. Make a scatter diagram for the data. Describe what happens to the one-day temperatures as the latitude increases.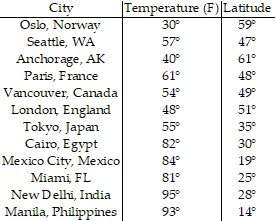 Latitude (degrees)
 Temperature (F)°
What will be an ideal response?
Latitude (degrees)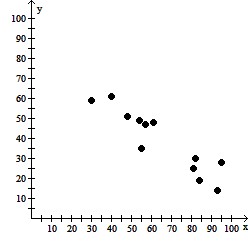
Temperature (F)°
As the latitude increases, the one-day temperatures decrease.
You might also like to view...
Provide an appropriate response.Estimating the answer, before calculating the exact answer, in some situations is beneficial.
A. True B. False
Solve the problem.A restaurant bill of $63.42 was shared equally by 5 people. How much was each person's share? Round your answer to the nearest cent.
A. $13.79 B. $12.79 C. $12.68 D. $13.68
The first term of a geometric sequence is 12 and the second term is 4 . Find the fifth term.
What will be an ideal response?
Find (f ? g)(x) and (g ? f)(x).f(x) = 2x + 11; g(x) = 11x + 2
A. (f ? g)(x) = 22x + 123 (g ? f)(x) = 22x + 15 B. (f ? g)(x) = 22x + 123 (g ? f)(x) = 22x + 123 C. (f ? g)(x) = 22x + 15 (g ? f)(x) = 22x + 123 D. (f ? g)(x) = 22x + 15 (g ? f)(x) = 22x + 15