Use a graphing calculator to plot the data and find the quadratic function of best fit.The number of housing starts in one beachside community remained fairly level until 1992 and then began to increase. The following data shows the number of housing starts since 1992 (x = 1). Use a graphing calculator to plot a scatter diagram. What is the quadratic function of best fit?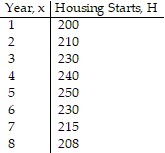
A. H(x) = -3.268x2 + 30.494x + 168.982
B. H(x) = -3.268x2 + 30.494x - 168.982
C. H(x) = -3.268x2 - 30.494x + 168.982
D. H(x) = 3.268x2 + 30.494x + 168.982
Answer: A
You might also like to view...
Either the dimensions of two matrices or the matrices themselves are given. Find the dimensions of the product AB and the product BA. If either is not defined, say so.A is 2 × 4; B is 2 × 4.
A. AB is 2 × 2; BA is 4 × 4. B. AB is 4 × 2; BA is 2 × 4. C. AB is 2 × 4; BA is 4 × 2. D. AB is not defined, BA is not defined.
Factor the polynomial completely.2x2 - x - 28
A. (2x + 7)(x - 4) B. (2x + 4)(x - 7) C. (2x - 7)(x + 4) D. (2x - 4)(x + 7)
Solve.A florist filled four orders for wedding flowers and made the following amounts of money: $370, $796, and $817. How much money on the average did she make per order?
A. $586 B. $710 C. $736 D. $686
Provide an appropriate response.When finding  ÷
÷  , what are the restrictions on the variables and why?
What will be an ideal response?