Assuming the firm in the graph shown is producing Q1 and charging P3, it is likely showing the cost and revenue curves of a monopolistically competitive firm that is:
These are the cost and revenue curves associated with a firm.
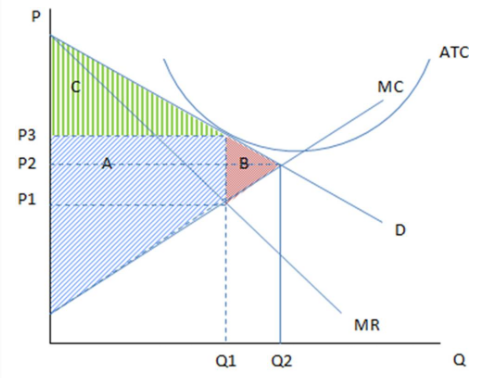
A. earning positive economic profits.
B. earning negative economic profits.
C. earning zero economic profits.
D. It is impossible to tell from the graph provided.
C. earning zero economic profits.
You might also like to view...
If real GDP in a year was $3,668 billion and the price index was 112, then nominal GDP in that year was approximately ________.
A. $3,925 billion B. $3,846 billion C. $4,108 billion D. $4,379 billion
The existence of scarcity in economics comes from
A) resources being limited in supply. B) people being stupid. C) governments being corrupt. D) the rich controlling most resources.
The production possibilities curve demonstrates which of the following concepts?
A. scarcity B. trade-offs C. choice D. all of these
The price of a new textbook increased from $100 to $120 in one year, while the price of a used textbook increased by 20 percent. What happened to the relative price of a used textbook?
A) It decreased by 25 percent. B) It increased by 20 percent. C) It remained constant. D) It can't be determined without knowing the nominal price of the used textbook in at least one of the years.