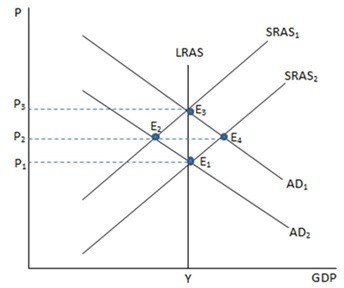
 If the economy is experiencing an economic boom, which point in the graph shown would likely represent this?
A. E1
B. E2
C. E3
D. E4
Answer: D
You might also like to view...
Which of the following is true?
A) The share of government expenditure in the GDP of US has fallen over the last 80 years. B) The share of consumption expenditure in the GDP of US has increased over the last 80 years. C) The share of exports in the GDP of US has grown over the last 80 years. D) The share of exports in the GDP of US has fallen over the last 80 years.
Which of the following is an in-kind transfer payment?
a. Medicaid. b. Social Security. c. unemployment insurance. d. Temporary Assistance to Needy Families.
If the Fed sells $10 million in bonds to a bank, and the required reserve ratio is 20 percent, then the banking system can:
a. decrease the money supply by up to $10 million. b. decrease the money supply by up to $40 million. c. decrease the money supply by up to $50 million. d. decrease the money supply by up to $2 million. e. increase the money supply by up to $50 million.
Supply shows
a. the quantity offered for sale at every possible price. b. the quantity people will buy at every possible price. c. the changes in quantity. d. how price changes when people buy more.