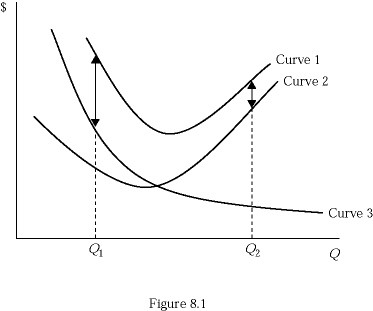
 Refer to Figure 8.1, which shows a family of average cost curves. The average variable cost at a given level of output is represented by:
A. the vertical distance between Curve 1 and Curve 3 at a given level of output.
B. the vertical distance between Curve 1 and Curve 2 at a given level of output.
C. the vertical sum of Curve 1 and Curve 3 at a given level of output.
D. the vertical sum of Curve 1 and Curve 2 at a given level of output.
Answer: A
You might also like to view...
Economic analysis assumes that, for each output level, the firm
a. operates at minimum point of its average total cost curve b. operates at minimum point of its long-run average total cost curve c. seeks lowest possible cost of producing that quantity of output d. produces at maximum point of its total revenue curve e. produces at maximum point of its total product curve
Bonds issued by state and local governments are called _____ bonds. Bonds issued by financially shaky corporations are called _____ bonds. Of these two, which type of bond usually pays a relatively higher interest rate?
Fill in the blank(s) with correct word
Based on the graph showing rational expectations and the AD/AS model, the change caused by expansionary policies is ______.
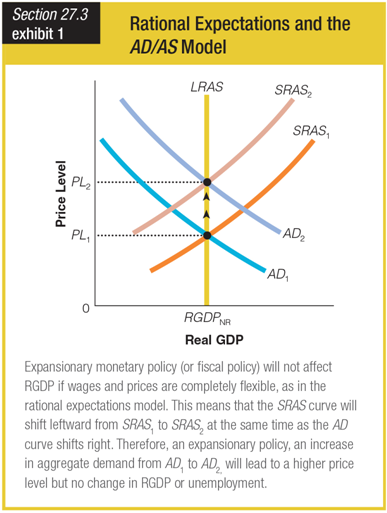
a. higher price levels
b. lower unemployment
c. higher RGDP
d. lower price levels
Compared to our trade deficit with Japan from 2002-2009, our deficit with China was
A. much larger. B. slightly larger. C. slightly smaller. D. much smaller.