Find a) the mean,  , of the data, b) the deviation from the mean for each data item, and c) the sum of the deviations.152, 159, 161, 166, 167
A. a) mean: 161, b) deviations: -9, -2, 0, 5, 6, c) sum: 11
B. a) mean: 161, b) deviations: -9, -2, 0, 5, 6, c) sum: 0
C. a) mean: 161, b) deviations: -9, -2, 0, 5, 6, c) sum: 22
D. a) mean: 159, b) deviations: -9, -2, 0, 5, 6, c) sum: 0
Answer: B
You might also like to view...
Solve the problem.Find any local extrema (maxima, minima, or saddle points) of  given that
  and
and 
A. Local minimum at 
B. Local maximum at 
C. Local minimum at 
D. Saddle point at 
Multiply.4x(2x - 4)
A. 2x2 - 16x B. -8x2 C. 8x2 - 4x D. 8x2 - 16x
Solve.The motion of a projectile that is fired at a 60° angle with the horizontal is given by x =  t,
t, 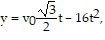 for t in
  Suppose a projectile is fired with an initial velocity of 400 feet per second at an angle of 60° with the horizontal. Find (a) the time when it reaches maximum altitude (b) the maximum altitude.
A. (a) 21.7 seconds (b) 4330 feet B. (a) 43.3 seconds (b) 11,250 feet C. (a) 6.3 seconds (b) 625 feet D. (a) 10.8 seconds (b) 1875 feet
Tell which of the following types of regression is likely to give the most accurate model for the scatter plot shown: linear regression, quadratic regression, cubic regression, exponential regression, sinusoidal regression.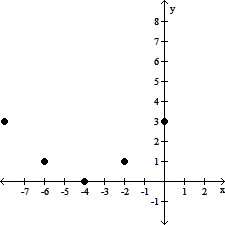
A. Cubic regression B. Sinusoidal regression C. Linear regression D. Exponential regression E. Quadratic regression