Exhibit 4-3 Supply and demand curves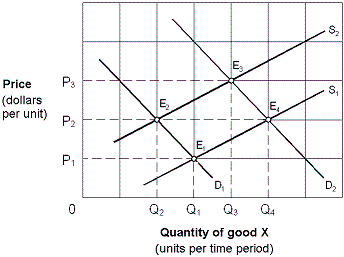
Initially the market shown in Exhibit 4-3 is in equilibrium at P2, Q2 (E2). Changes in market conditions result in a new equilibrium at P2, Q4 (E4). This change is stated as a(n):
A. increase in supply and an increase in demand.
B. increase in supply and a decrease in demand.
C. decrease in demand and a decrease in supply.
D. increase in demand with supply held constant at S2.
Answer: A
You might also like to view...
Explain why many fishermen on a commonly owned lake continue to fish until the revenue from the average catch is equal to the marginal cost of fishing -- and why the same is not true for a firm that employs fishermen to fish on a privately owned lake.
What will be an ideal response?
A car dealer advertises free satellite radio for one year with the purchase of a new car. This is an example of:
A. bait and switch. B. marginal sales. C. an incentive. D. voluntary exchange.
Which of the following would shift the aggregate demand curve to the right?
a. An increase in government purchases b. An increase in investment spending c. An open market purchase of bonds by the Fed d. All of the above e. None of the above
For any competitive labor market, what change would have to occur to cause the labor supply to increase and shift the supply curve right?
A. Opportunity cost of work decreases B. Number of firms increases C. Number of workers decreases D. Opportunity cost of work increases