Refer to the information provided in Figure 26.3 below to answer the question(s) that follow.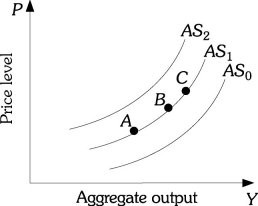 Figure 26.3Refer to Figure 26.3. A shift from AS1 to AS0 represents a(n)
A. decrease in aggregate supply.
B. decrease in aggregate quantity supplied.
C. increase in aggregate quantity supplied.
D. increase in aggregate supply.
Answer: D
You might also like to view...
In the above figure, at the real wage rate of $50
A) there is a surplus of 100 billion hours per year. B) there is a shortage of 100 billion hours per year. C) there is a surplus of 60 billion hours per year. D) there is shortage of 20 billion hours per year.
The lower left-hand corner of a graph where the two axes meet is called the graph’s origin.
Answer the following statement true (T) or false (F)
The Fed's low short-term interest rate policy of 2002 to 2004 encouraged decision makers to
What will be an ideal response?
Unemployment due to the length of time it takes to find employment upon entering the labor force or voluntarily between jobs is called
A. cyclical unemployment. B. frictional unemployment. C. structural unemployment. D. natural unemployment.