Graph the inequality.x ? 6
A. 
B. 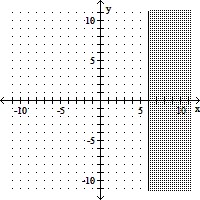
C. 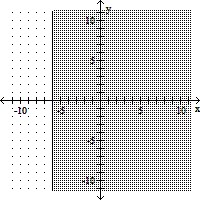
D. 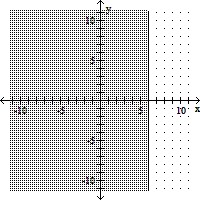
Answer: B
You might also like to view...
Write a linear inequality that describes the shaded region.y = -2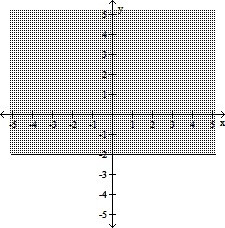
A. x ? -2 B. x ? -2 C. y ? -2 D. y ? -2
Find a so that the statement is true.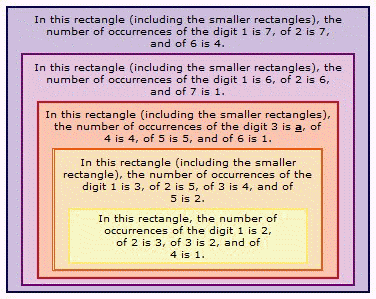
A. 0 B. 5 C. 4 D. 7 E. 3
Multiply by 1, 2, 3, and so on, to find ten multiples of the number.100
A. 100, 110, 120, 130, 140, 150, 160, 170, 180, 190 B. 0, 100, 200, 300, 400, 500, 600, 700, 800, 900 C. 100, 200, 300, 400, 500, 600, 700, 800, 900, 1000 D. 100, 150, 200, 250, 300, 350, 400, 450, 500, 550
Solve the problem.The bar graph below shows a company's yearly profits from 1991 to 1999. Let an represent the company's profit, in millions, in year n, where n=1 corresponds to 1991, n = 2 corresponds to 1992, and so on. 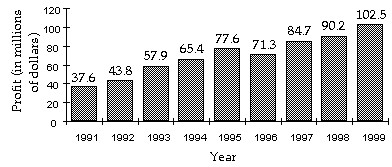 Find
Find 
A. $142.6 million B. $400.7 million C. $371.3 million D. $356.9 million