Exhibit 4-8 Demand and supply curves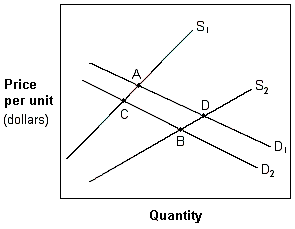
In Exhibit 4-8, a movement from A to D is best described as a(n):
A. increase in the quantity demanded and an increase in supply.
B. increase in supply and demand.
C. increase in both the quantity demanded and supplied.
D. increase in the quantity supplied and in the demand.
Answer: A
You might also like to view...
Real GDP is $700 billion, average hours worked per week is 42 and aggregate hours is 150 billion hours. What is the economy's labor productivity?
A) $3.75 per hour B) $1.80 per hour C) $4.67 per hour D) $16.67 per hour E) $4.50 per hour
Of the $840 billion American Recovery and Reinvestment Act stimulus package which was enacted in 2009, approximately ________ took the form of tax cuts and ________ took the form of increases in government expenditures
A) one-third; two-thirds B) one-tenth; nine-tenths C) one-half; one-half D) three-fourths; one-fourth
When a corporation experiences financial problems, bondholders are paid before stockholders
a. True b. False Indicate whether the statement is true or false
Table 1.3 shows the hypothetical trade-off between different combinations of brushes and combs that might be produced in a year with the limited capacity for Country X, ceteris paribus.Table 1.3Production Possibilities for Brushes and CombsCombinationNumber of combsOpportunity Cost(Foregone brushes)Number of brushesOpportunity Cost (Foregone combs)J4 0NAK3 10 L2 17 M1 21 N0NA23 On the basis of Table 1.3, the lowest opportunity cost for combs in terms of brushes is
A. 8.5 brushes per comb. B. 0.33 brush per comb. C. 10 brushes per comb. D. 2 brushes per comb.