The pie chart shown below represents the grades of 260 students in Professor Blackbeard's Stat 101 class.
According to the chart, approximately how many students passed with a grade of 'C' or better?
A. 32
B. 206
C. 79
D. 82
E. none of these
Answer: B
You might also like to view...
A right triangle has legs a and b with hypotenuse c. Find the length of the missing side. Round the answer to three decimal places, if necessary.a = 15, b = 36
A. c = 33 B. c = 7 C. c = 27 D. c = 39
Sketch the graph of the rational function.f(x) = 
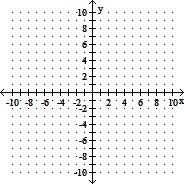
A. 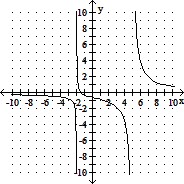
B. 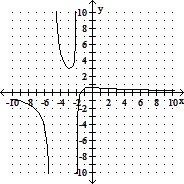
C. 
D. 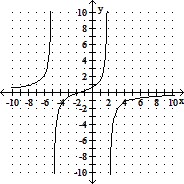
Evaluate the expression.
A. 0! B. 5 C. 10 D. 1
The 1999 monthly cost for health care for an employee and two dependents is given in the table. Draw a box plot for the monthly costs of health care (ranked from lowest to highest) and determine the values ofQ?1, Q?2and Q?3. ProviderCostMaxicare$415.41Cigna$429.41Health Net$427.15Pacific Care$428.80Kaiser$433.38Aetna U.S. Healthcare$435.19Blue Shield HMO$443.24Omni Healthcare$457.12?
A. Q 1 = 428.28, Q 2 = 431.09, Q 3 = 446.155 B. Q 1 = 428.28, Q 2 = 431.09, Q 3 = 439.215 C. Q 1 = 428.28, Q 2 = 429.41, Q 3 = 439.215 D. Q 1 = 428.8, Q 2 = 431.09, Q 3 = 446.155 E. Q 1 = 439.215, Q 2 = 431.09, Q 3 = 428.28