Solve the problem.You brake your car from a speed of 65 mph. The table shows data that represent your car's speed versus the amount of time elapsed from the moment that you began to brake.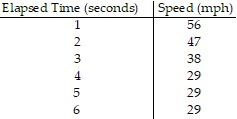 Graph the data. What is the slope of the line segment that represents the period of time during which the speed decreases?
A. 
The slope of the decrease is -10.
B. 
The slope of the decrease is -9.
C. 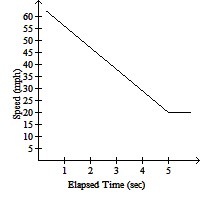
The slope of the decrease is -9.
D. 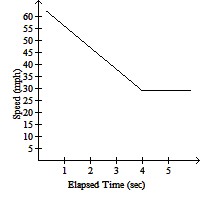
The slope of the decrease is 9.
Answer: B
You might also like to view...
Which of the following can be determined to be true, given the following: A - B> C, where A, B, and C are natural numbers? ?
A.
? < 1
< 1
B.
?
C.
? > 1
> 1
D.
? < 1
< 1
E.
?
In a small town shopping mall, market researchers recorded the number of children who requested video games while visiting "Santa." The bar graph below shows the results for five consecutive years. Use the information given by the graph to determine the truth value of the statement. 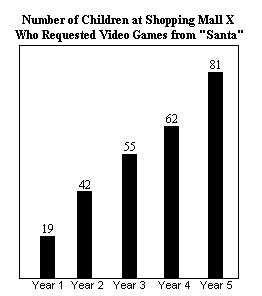 If there was a decrease in the number of children at this mall requesting video games from Year 1 to Year 2, then more than 85 children at this mall requested computer games in Year 5.
A. True B. False
Solve the problem.Anne and Nancy use a metal alloy that is 17.3% copper to make jewelry. How many ounces of a 13% alloy must be mixed with a 20% alloy to form 70 ounces of the desired alloy?
A. 48 ounces B. 29 ounces C. 43 ounces D. 27 ounces
Find the LCD of the given fractions by prime factorization. ,
,  and
and 
A. 6 B. 10 C. 15 D. 30