Solve the inequality. Graph the solution set, and state the solution set in interval notation.|x| < 2
A. (-?, 2]![]()
B. [-2, 2]![]()
C. (-?, -2) ? (2, ?)![]()
D. (-2, 2)![]()
Answer: D
You might also like to view...
Graph the integrand and use geometry to evaluate the integral.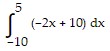
A. 75 B. 225 C. 450 D. 300
Use Venn diagrams to determine whether the following statements are equal for all sets A and B.(A ? B)', A' ? B'
A. equal B. not equal
Graph the line described.Through (6, 0); m = - 
A. 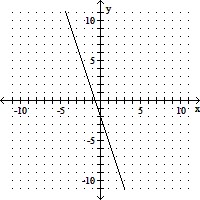
B. 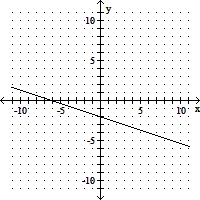
C. 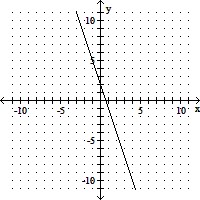
D. 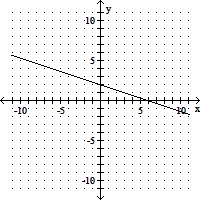
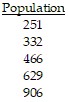
Solve the problem.The population (in hundred thousands) for the Colonial United States in ten-year increments for the years 1700-1780 is given in the table. (Source: 1998 Information Please Almanac)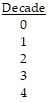 ?
? ?
?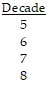 ?
?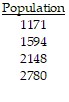 State whether the data can be more accurately modeled using an exponential function or a logarithmic function. Using a graphing utility, find a model for population (in
hundred thousands) as a function of decades since 1700. What will be an ideal response?