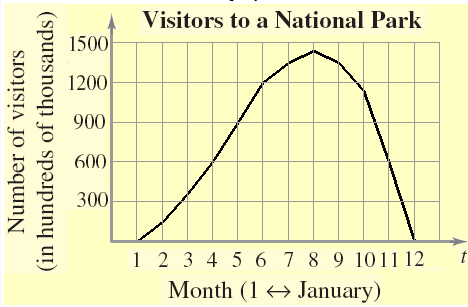
The graph shows the number of visitors V to a national park in hundreds of thousands during a one-year period, where  represents January. Estimate the rate of change of V over the interval
  . Round your answer to the nearest hundred thousand visitors per year.
?
?
A. 187.5 hundred thousand visitors per year
B. 281.25 hundred thousand visitors per year
C. 225 hundred thousand visitors per year
D. 562.5 hundred thousand visitors per year
E. 1125 hundred thousand visitors per year
Answer: C
Mathematics
You might also like to view...
Express the number  FIGURE 1.png) as a ratio of integers.
as a ratio of integers.
What will be an ideal response?
Mathematics
Find the linearization of the function at the given point.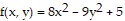 at
at 
A. 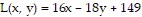
B. 
C. 
D. 
Mathematics
Multiply.10ax2(8ax6 - 11x2 - 6)
A. 80a2x8 - 110ax4 B. 80ax6 - 110x2 - 60 C. 80a2x8 - 110ax4 - 60ax2 D. 80a2x8 - 11x2 - 6
Mathematics
Graph the inequality.y ? 3x + 4
A. 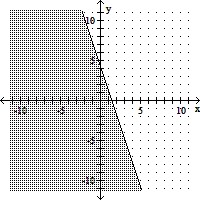
B. 
C. 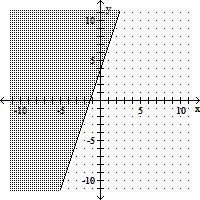
D. 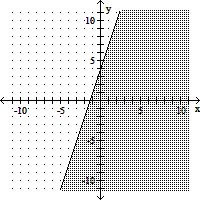
Mathematics