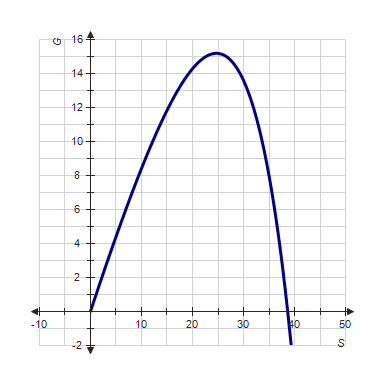
The growth rate G, in hundreds of cases per day, in the spread of an epidemic depends on the number S, in hundreds, of currently sick individuals. The relationship is given by
?
 .
.
A: Make a graph of G versus S. Include up to 4,000 currently sick people (corresponding to  ).B: There are two numbers of currently sick individuals that give a growth rate of 500 new cases per day (corresponding to
  ). Find both of them.C: When there are no sick individuals, the growth rate is 0. There is a second level where the growth rate is 0. Find that number of currently sick people.
?
Round your answer to two decimal places if necessary.
What will be an ideal response?
A:
?
?
B: 5.73 hundred and 36.54 hundred
?
C: 39.6 hundred
?
You might also like to view...
The following table shows the height H, in centimeters, of a certain type of flower when it is t weeks old.
?
 258101315
 6.1119.7638.5541.541.3242.93?
Based on the table, what do you expect is the limiting value of H?
6.1119.7638.5541.541.3242.93?
Based on the table, what do you expect is the limiting value of H?
What will be an ideal response?
A function f(x), a point x0, the limit of f(x) as x approaches x0, and a positive number ? is given. Find a number  such that for all x, 0 <
  < ? ?
< ? ?  < ?.f(x) = -8x + 1, L = -23, x0 = 3, and ? = 0.01
A. 0.005 B. 0.0025 C. -0.003333 D. 0.00125
Write the vertex form of a parabola that satisfies the conditions given. Then write the equation in the form Vertex (3, 4) and a = 5
A. y = 5(x - 4)2 + 3; y = 5x2 - 30x + 49 B. y = 5(x - 4)2 + 3; y = 5x2 + 49x - 30 C. y = 5(x - 3)2 + 4; y = 5x2 + 5x + 49 D. y = 5(x - 3)2 + 4; y = 5x2 - 30x + 49
Write an equation that expresses the relationship. Use k for the constant of proportionality.P varies jointly as R and S and inversely as the square root of a.
A. P = 
B. P = 
C. P = 
D. P = 