Add.+ 
A. 4.6458
B. 4.5448
C. 4.6448
D. 4.6658
Answer: A
You might also like to view...
Provide an appropriate response.Describe the difference between the graphical solutions x < 3 and x ? 3.
What will be an ideal response?
Use the figure below. Determine whether the given statement is true or false. 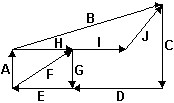 C + D + G + I + J = 0
A. True B. False
Divide using synthetic division, and write a summary statement in fraction form.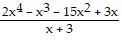
A. 2x3 - 7x2 + 6x + 15 + 
B. 2x3 - 5x2 + 3 + 
C. 2x3 + 5x2 + 3 + 
D. 2x3 - 7x2 + 6x - 15 + 
Solve the problem.The following polynomial approximates the shark population in a particular area. 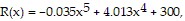 where x is the number of years from 1985. Use a graphing calculator to describe the shark population from the years 1985 to 2010.
A. The population remains stable. B. The population decreases. C. The population increases.