Use the following supply and demand graph to answer the question below.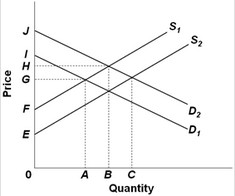 S1 and D1 represent the current market supply and demand, respectively. S2 and D2 represent the socially optimal supply and demand. The positions of the graphs indicate that there is (are) external
A. benefits from production and external costs from consumption of the product.
B. costs from production and external benefits from consumption of the product.
C. costs from production and consumption of the product.
D. benefits from production and consumption of the product.
Answer: D
You might also like to view...
Bonds that are sold in a foreign country and are denominated in the country's currency in which they are sold are known as
A) foreign bonds. B) Eurobonds. C) equity bonds. D) country bonds.
The nations of the European Union currently number _____, since _____ joined in 2013.
A) 50; France and Germany B) 28; Croatia C) 150; Turkey and Greece D) 13; Mexico and Canada
If a perfectly competitive firm sells 50 units of output at a market price of $10 per unit, its marginal revenue is:
A. more than $10. B. less than $10. C. $10. D. $500.
Agri-Tech supplies a patented sweetener to various food processors. It has noticed that the value of the sweetener varies dramatically from one buyer to another, depending on the end-use demand. But its experiments with charging higher prices to some buyers have failed because:
A. outsourcing is compromised by contracting costs. B. of market arbitrage. C. the cost of production is always the same. D. price discrimination is illegal.