Consider an investment with the following payoffs and probabilities: State of the Economy Probability Return Stability .50 1,000 Good Growth .50 2,000 Determine the expected return for this investment
a. 1,300
b. 1,500
c. 1,700
d. 2,000
e. 3,000
b
You might also like to view...
Refer to Figure 3.4. A Nash equilibrium is achieved at which cell(s) in the payoff matrix?
A) only at (North, North) B) only at (South, South) C) at both (North, North) and at (South, South) D) There is no Nash equilibrium.
The effect of an import quota is
A) to shift the supply curve up by the amount of the quota. B) to lead to a decrease in demand. C) to make the supply curve vertical at the amount of the quota. D) to make the supply curve horizontal at the amount of the quota.
Table 5.1National Income Accounts (dollar figures are in billions)Expenditures for consumer goods and services$4,565Exports$740Government purchases of goods and services$1,465Social Security taxes$510Net investment$225Indirect business taxes$520Imports$825Gross investment$865Corporate income taxes$185Personal income taxes$750Corporate retained earnings$45Net foreign factor income$20Government transfer payments to households$690Net interest payments to households$0On the basis of Table 5.1, depreciation is
A. $85 billion. B. $50 billion. C. $640 billion. D. $690 billion.
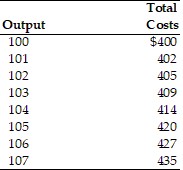 Refer to the above table. If the price is $6 the maximum profit this firm could earn is
A. $210. B. $420. C. $630. D. $414.