Exhibit 16-3 Money market demand and supply curves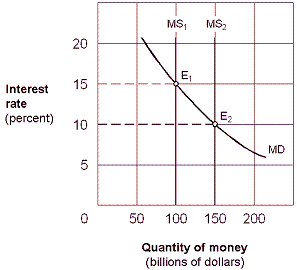
As shown in Exhibit 16-3, assume the money supply curve shifts rightward from MS1 to MS2 and the economy is operating along the intermediate segment of the aggregate supply curve. The result will be a:
A. higher investment, lower real GDP, and lower price level.
B. lower investment, lower real GDP, and lower price level.
C. higher investment, higher real GDP, and higher price level.
D. higher interest rate and no effect on real GDP or the price level.
Answer: C
You might also like to view...
Refer to Figure 13-2. Ceteris paribus, a decrease in the price level would be represented by a movement from
A) SRAS1 to SRAS2. B) SRAS2 to SRAS1. C) point A to point B. D) point B to point A.
Which of the following statements correctly characterizes the distribution of colonial wealth?
a. Colonial wealth was distributed equally across the population. b. While the distribution wealth was highly concentrated in the South, New England , the Middle colonies had very equal wealth distributions. c. Wealth inequality tended to be greatest in colonial cities. d. A permanent underclass of free poor people developed during the colonial period.
Federal Reserve Notes are
A. the currency part of the United States money supply. B. United States government securities owned by the Fed. C. the backing for all bank account balances. D. used exclusively by the government to pay off its debt.
Refer to the information provided in Table 3.1 below to answer the question(s) that follow. Table 3.1Price per PizzaQuantity Demanded (Pizzas per Month)Quantity Supplied (Pizzas per Month)$31,200 600 61,000 700 9 800 80012 600 90015 4001,000Refer to Table 3.1. In this market there will be an excess supply of 600 pizzas at a price of
A. $3. B. $6. C. $12. D. $15.