Refer to the diagram. The average propensity to consume:
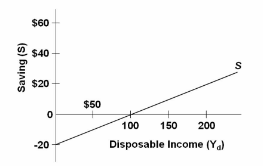
A. is greater than 1 at all levels of disposable income above $100.
B. is greater than 1 at all levels of disposable income below $100.
C. is equal to the average propensity to save.
D. cannot be determined from the information given.
B. is greater than 1 at all levels of disposable income below $100.
You might also like to view...
Based on the figure above, curve B is the firm's
A) marginal cost curve. B) total cost curve. C) average total cost curve. D) total variable cost curve. E) total fixed cost curve.
Suppose you borrow $1,000 at an interest rate of 12 percent. If the expected real interest rate is 5 percent, then the rate of inflation over the upcoming year that would be most beneficial to you would be a rate of inflation
A) greater than 7 percent. B) equal to 7 percent. C) less than 7 percent. D) equal to 0 percent.
A perfectly competitive firm sells 15 units of output at the going market price of $10. Suppose its average fixed cost is $15 and its average variable cost is $8. Its contribution margin (i.e., contribution to fixed cost) is
A) $30. B) $150. C) $105. D) Cannot be determined from the above information
Over time, the hierarchy of firms has tended to move from
A) upstream to downstream. B) hierarchical to non-hierarchical. C) lateral to parallel. D) big to small to big again.