Professor's economics students are constructing models for how gasoline prices change. Maria's model has very realistic assumptions and is quite complex. Anna's model is less complicated and less realistic. Maria's model correctly predicts gas price increases 5% of the time. Anna's model predicts correctly 15% of the time. On the basis of usefulness or "goodness," Professor will give which student's model the higher grade and why?
A. Maria's model gets the higher grade because it is more realistic.
B. Anna's model gets the higher grade because it predicts accurately more often.
C. Maria's model gets the higher grade because it is more complex.
D. Anna's model gets the higher grade because it is simpler.
Answer: B
You might also like to view...
Which of the following statements is true of the U.S. economy in 2014, as per the records of the BLS?
A) Number of unemployed workers > number of adults out of the workforce > number of employed workers B) Number of employed workers > number of adults out of the workforce > number of unemployed workers C) Number of unemployed workers > number of employed workers > number of adults out of the labor force D) Number of employed workers > number of unemployed workers > number of adults out of the labor force
If we observe firms earning zero economic profits in the short run, we know that
A) the industry must be perfectly competitive. B) the industry must be either perfectly competitive or monopolistically competitive. C) there must not be any barriers to entry. D) any market structure is possible since firms under any market structure can earn zero profits at some time.
Gross Domestic Product (GDP) is the total market value of all
A) final goods and services produced annually within a country's borders. B) final and intermediate goods and services produced annually within a country's borders. C) intermediate goods and services produced annually within a country's borders. D) final goods produced every month within a country's borders.
Refer to the information provided in Figure 2.5 below to answer the question(s) that follow.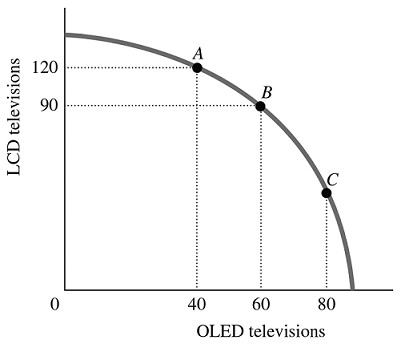 Figure 2.5Refer to Figure 2.5. For this economy to move from Point C to Point B, ________ additional LCD TVs could be produced when the production of OLED TVs is reduced by 20.
A. exactly 30 B. exactly 60 C. fewer than 30 D. more than 30