Figure 19-1
?

Of the graphs in Figure 19-1, which one shows that an expansion of the Japanese economy leads to a depreciation of the yen?
A. 1
B. 2
C. 3
D. 4
Answer: C
You might also like to view...
A negative externality exists when
A. marginal social costs are less than marginal private costs. B. marginal social costs are greater than marginal private costs. C. marginal social benefits are less than marginal private benefits. D. marginal social benefits are greater than marginal private benefits. E. b and c
Exhibit 15-1 Disposable income and consumption data Income (Y) Change inDisposable Income Consumption (C) 0 500 1,000 1,000 1,400 2,000 1,000 2,200 3,000 1,000 2,900 4,000 1,000 3,500 5,000 1,000 4,000 In Exhibit 15-1, when disposable income is increased from $2,000 to $3,000 to $4,000,
A. total consumption increases by $1,000. B. the marginal propensity to consume remains constant. C. the marginal propensity to consume decreases from 0.7 to 0.6. D. the marginal propensity to consume decreases from 0.8 to 0.7.
Use the monetary policy reaction curve to link a higher inflation rate to lower aggregate demand.
What will be an ideal response?
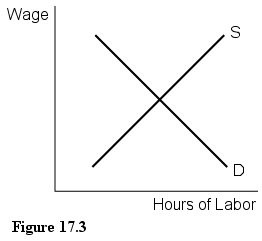 In Figure 17.3, an increase in the demand for labor will cause the equilibrium:
A. wage and hours of labor used to increase. B. wage and hours of labor used to decrease. C. wage to increase and hours of labor used to decrease. D. wage to decrease and hours of labor used to increase.