Use the following graph for the milk market to answer the question below. 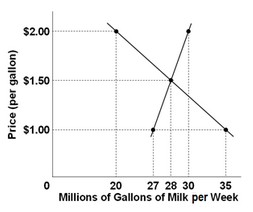 In this market, the equilibrium price is ________ and equilibrium quantity is ________
A. $1.50 per gallon; 28 million gallons.
B. $28 per gallon; 150 million gallons.
C. $1.00 per gallon; 35 million gallons.
D. $1.50 per gallon; 30 million gallons.
Answer: A
You might also like to view...
Explain how the S-curve reflects the typical nature of complementarities?
What will be an ideal response?
When the market is in equilibrium,
a. Total surplus is minimized b. Total surplus is maximized without government intervention c. Government maximizes total revenue d. None of the above
The vertical portion of the aggregate supply curve shows that at full employment an increase in the price level will:
a. not alter the economy's full-employment real GDP. b. increase the economy's full-employment real GDP. c. reduce the quantity of goods and services purchasers will demand. d. improve the overall efficiency of resource use.
In order to achieve market power, monopolistically competitive firms use
A. predatory pricing. B. strategic behavior. C. product differentiation. D. their size.