The pie chart below shows the number of pizzas consumed by college students in a typical month. Use the chart to answer the question. 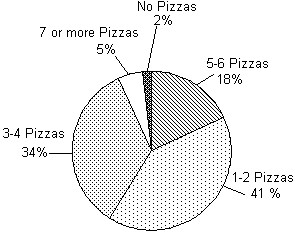 What percent of college students consume 1-2 pizzas in a typical month?
A. 18%
B. 34%
C. 41%
D. 2%
Answer: C
Mathematics
You might also like to view...
Add or subtract as indicated. Simplify, if necessary. +
+ 
A. - 
B. 
C. - 
D. 
Mathematics
Write the series in summation notation. Use the index i and let i begin at 1 in each summation.0 + 2 + 6 + 12 + 20
A. 
B. 
C. 
D. 
Mathematics
Find the real solutions of the equation.(2x + 3)1/3 = 3
A. 
B. 
C. 
D. 
Mathematics
Write the expression in interval notation. Graph the interval.x > 6![]()
A. (6, ?]![]()
B. [6, ?]![]()
C. [6, ?)![]()
D. (6, ?)![]()
Mathematics