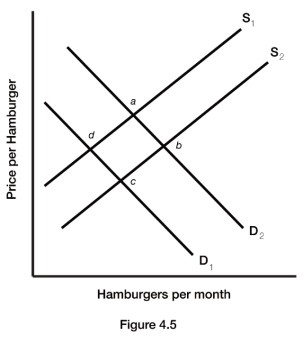
 Figure 4.5 illustrates a set of supply and demand curves for hamburgers. An increase in supply and an increase in quantity demanded are represented by a movement from:
A. point a to point b.
B. point a to point c.
C. point d to point b.
D. point c to point d.
Answer: A
You might also like to view...
The new Consumer Financial Protection Bureau is an independent agency but is funded and housed within
A) the Treasury Department. B) the Federal Reserve. C) the SEC. D) the IRS.
If zinc suppliers are successful in forming an international zinc cartel, they will
a. lower output and raise prices, which discourages the entry of new firms into the industry. b. lower output, raise prices, and have a need to prevent the entry of new firms into the industry. c. raise output and raise prices, which discourages the entry of new firms into the industry. d. raise output, raise prices, and have a need to prevent the entry of new firms into the industry.
Interpret what an increase in demand and an increase in supply mean. Discuss the causes of an increase in demand and an increase in supply. How are increases in demand and supply expressed graphically? ?
What will be an ideal response?
What is the income effect for leisure demand?
What will be an ideal response?