Using the concepts of graphing inequalities, determine the inequality which describes the graph.
A. y ? 3x + 5
B. y ? -3x + 5
C. y ? 3x + 5
D. y ? -3x + 5
Answer: D
You might also like to view...
Provide an appropriate response.Urban encroachment is causing the area of a forest to decline at a rate of 3% per year. Use the approximate half-life formula to determine the fraction that remains in 63 years.
A. 0.535887 B. 0.970731 C. 1.350000 D. 0.153893
Find the indicated decile or percentile.The normal annual precipitation (in inches) is given below for 21 different U.S. cities. Find the eighteenth percentile, P18.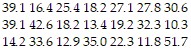
A. 13.4 B. 12.9 C. 13.0 D. 14.2
In the following question(s), FN represents the Nth Fibonacci number.F515 - 3F510 - 5F511 =
A. F512 + F513 + F514 B. -506 C. 0 D. -3570 E. none of these
Determine the degree and the coefficient of the monomial.6x2
A. Degree 6, coefficient -1 B. Degree 6, coefficient 6 C. Degree 0, coefficient 0 D. Degree 2, coefficient 6