Table 34-3
?
?
Output Per Unit Labor Input
?
Cotton
Wheat
Egypt
10
2
United States
20
20
The data in Table 34-3 indicate that the United States has
A. an absolute advantage in both goods, and a comparative advantage in cotton.
B. an absolute advantage in both goods, and a comparative advantage in wheat.
C. only a comparative advantage in wheat.
D. only a comparative advantage in cotton.
Answer: B
You might also like to view...
Each of the four firms in an industry has a market share of 25 percent. The Herfindahl-Hirschman Index equals
A) 3,600. B) 100. C) 625. D) 25. E) 2,500.
_______ has more flights hopping around the country than any other carrier
Fill in the blank(s) with the appropriate word(s).
If the total cost function is TC = Q3 - 6Q2 + 14Q + 75, at what output is the AVC = MC?
What will be an ideal response?
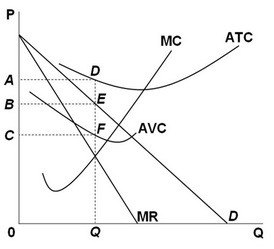 Refer to the above graph. Consider a monopolist in short-run equilibrium. This monopolist has total fixed cost equal to area:
A. ABED. B. ADFC. C. 0CFQ. D. BEFC.