Solve the problem.The table shows the number of deaths due to car accidents in a certain city in various years. 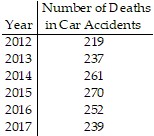 Let f(t) be the number of deaths due to car accidents at t years since 2012. Suppose that you wish to model f using a quadratic equation. What is the vertex of the model? What does it mean in this situation?
A. (0, 202); the smallest number of deaths due to car accidents was 202 in 2012
B. (2, 261); the largest number of deaths due to car accidents was 261 in 2014
C. (3, 270); the largest number of deaths due to car accidents was 270 in 2015
D. (5, 219); the smallest number of deaths due to car accidents was 219 in 2017
Answer: C
You might also like to view...
Find the standard deviation. Round to one more place than the data.9, 20, 16, 16, 7, 15, 17, 18, 5, 16
A. 5.0 B. 4.7 C. 4.5 D. 1.5
Find an equation of an ellipse satisfying the given conditions.Vertices: (0, -10) and (0, 10); length of minor axis: 6
A.  +
+  = 1
= 1
B.  +
+  = 1
= 1
C.  +
+  = 1
= 1
D.  +
+  = 10
= 10
The graph of a function f is given. Use the graph to answer the question.What is the y-intercept?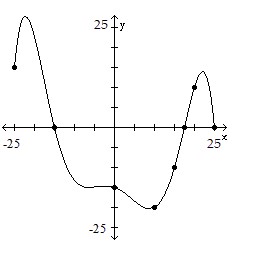
A. (0, -15) B. (0, 17.5) C. (0, -20) D. (0, 25)
Simplify.5 ? (3 + 5)2 - 3 ? (5 - 3)2
A. 388 B. 1268 C. 1564 D. 308