Refer to the figure below.________ inflation will eventually move the economy pictured in the diagram from short-run equilibrium at point ________ to long-run equilibrium at point ________, 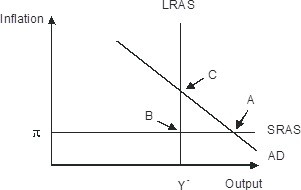
A. Rising; B; C
B. Falling; A; C
C. Falling; A; B
D. Rising; A; C
Answer: D
You might also like to view...
Briefly explain the command-and-control approach in dealing with an externality such as pollution. Give an example of the U.S. government using the command-and-control approach to deal with the pollution problem
What will be an ideal response?
Based on Scenario 6.1 above, if a tariff of 20 percent is placed on imports of dining room tables, the effective rate of protection is
A) 20 percent. B) 25 percent. C) 30 percent. D) 40 percent. E) There is not enough information to tell.
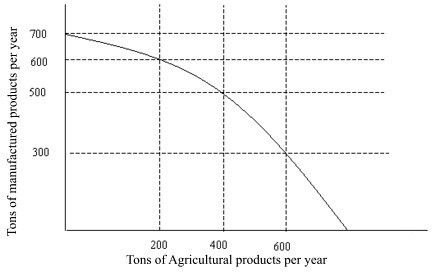
 Refer to Figure 2.1. If you are producing 600 tons of agricultural products per year, what is the maximum amount of manufactured products you can produce per year?
A. 300 tons B. 500 tons C. 600 tons D. 700 tons
Refer to the information provided in Figure 2.5 below to answer the question(s) that follow.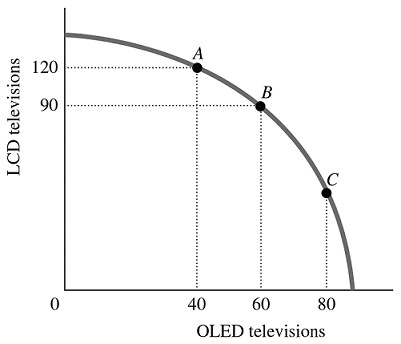 Figure 2.5Refer to Figure 2.5. The best point for society would be
A. either Point B or Point C, as the total amount being produced at either of these points is approximately the same. B. at any of the labeled points, as all of the points represent an efficient allocation of resources. C. Point C, as at this point there are approximately equal amounts of LCD and OLED televisions being produced. D. indeterminate from this information, as we don't have any information about the society's desires.