Solve . Round the answer to three decimal places.68x = 3.8
A. 0.345
B. 0.107
C. 0.093
D. 0.358
Answer: C
You might also like to view...
The stack plot below shows the value of each of Danny's investments. The stack plot contains three regions. The uppermost unshaded region represents the value of Danny's investment in individual stocks. The center shaded region represents the value of Danny's investment in mutual funds and the bottom region in black represents the value of Danny's investment in a CD. The thickness of a region at a particular time tells you its value at that time.  Use the graph to answer the question.In which year was the value of Danny's investment in individual stocks the least?
A. year 0 B. year 7 C. year 1 D. year 8
Graph each set of numbers. , 4,
, 4,  , -5
, -5
A. ![]()
B. ![]()
C. ![]()
D. ![]()
Complete the horizontal analysis for the comparative income statement. Round to the nearest tenth of a percent.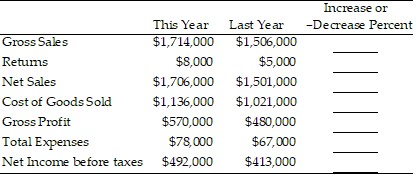
A. 12.1%, 37.5%, 12.0%, 10.1%, 15.8%, 14.1%, 16.1% B. 13.8%, 60.0%, 13.7%, 11.3%, 18.8%, 16.4%, 19.1% C. 7.2%, -140.0%, 7.0%, 1.5%, -2.1%, -132.8%, -5.1% D. -13.8%, -60.0%, -13.7%, -11.3%, -18.8%, -16.4%, -19.1%
Write a general term an for the sequence. Assume that n begins with 1.-3, -1, 1, 3, 5, . . .
A. an = 2n + 5 B. an = 2n - 6 C. an = 2n - 5 D. an = 4n - 5