Figure 6.2 illustrates a change in the price of soup. From the graph, we can conclude that:
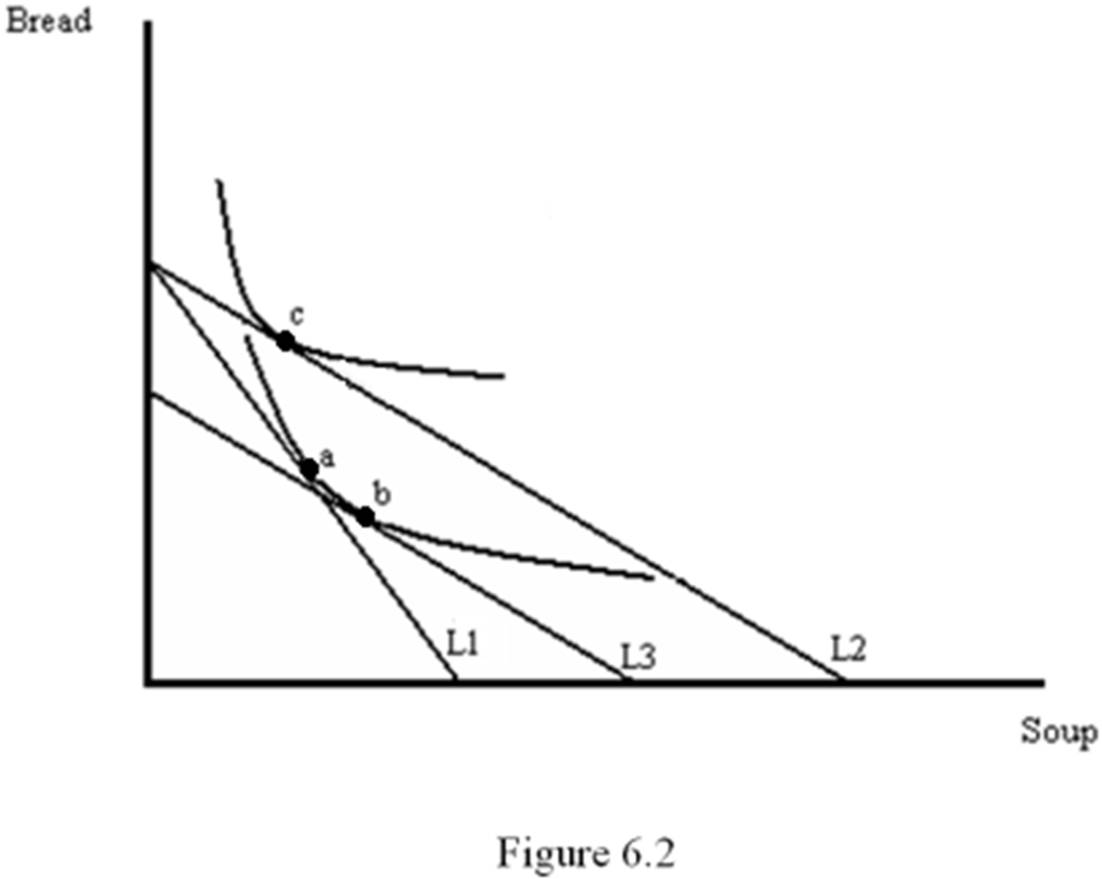
A. the price of soup has increased and soup is a Giffen good.
B. the price of soup has fallen and soup is a Giffen good.
C. the price of soup has fallen and soup is a normal good.
D. the price of soup has fallen and bread is a Giffen good.
B. the price of soup has fallen and soup is a Giffen good.
You might also like to view...
Which of the following assets is the most liquid in the United States?
A) U.S. Treasury Bonds B) corporate bonds C) U.S. currency D) an antique car
Use the law of diminishing marginal utility to explain why a pizza parlor might price pizzas in the following way: "Buy one pizza for $12, get the second pizza for $6." Why not simply charge $9 per pizza instead?
Why does the economy's aggregate demand curve have a negative slope?
Economics is the study of how evenly goods and services are distributed within society
a. True b. False Indicate whether the statement is true or false