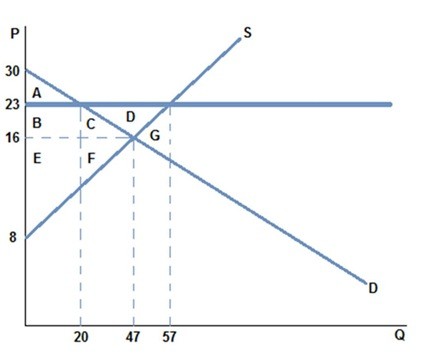
 The graph shown best represents:
A. a missing market.
B. a binding price floor.
C. a market for an inferior good.
D. a binding price ceiling.
Answer: B
You might also like to view...
Refer to Figure 2-8. If Vidalia chooses to produce 80 dozen roses, how many orchids can it produce to maximize production?
A) 24 dozen orchids B) 48 dozen orchids C) 60 dozen orchids D) 74 dozen orchids
The gross domestic product (GDP) of an economy for a particular year is likely to increase if _____
a. workers go on longer vacations during that year b. the length of an average work week decreases c. homeowners hire lawn care services rather than maintaining the lawns themselves d. people cook food at home instead of buying restaurant meals e. the sale of illegal drugs increases
Which of the following is false?
a. A production possibilities curve represents the potential total output combinations of any two goods for an economy. b. On a production possibilities curve, we assume that the economy has a given quantity and quality of resources and technology available to use for production. c. If an economy is operating inside its production possibilities curve, it is not at full capacity, and is operating inefficiently. Such an economy's actual output is less than potential output. d. By putting unemployed resources to work or by putting already employed resources to better uses, we could shift out the production possibilities curve.
The term for a broad measure of the balance of trade that includes trade in goods and services as well as international flows of income and foreign aid is
a. current account balance. b. merchandise trade balance. c. unilateral transfer balance. d. goods account balance.