Provide an appropriate response.You wish to test the hypotheses shown below. Null hypothesis: mean = 40 Alternative hypothesis: mean > 40Would you be inclined to reject the null hypothesis if the sample mean turned out to be much smaller than 40? Explain your thinking.
What will be an ideal response?
No. The alternative hypothesis is that the population mean is greater than 40. A sample mean much smaller than 40 does not provide evidence in favor of this alternative hypothesis. The null hypothesis should be rejected only if the sample mean turns out much larger than 40.
You might also like to view...
Express the rational number as a decimal.
A. 0.
B. 0.
C. 0.15
D. 0.1
Find the value of the polynomial function.f(x) = 9x2 + 5x; f(4)
A. 153 B. 144 C. 56 D. 164
Use the discriminant of the equation to determine the number of x-intercepts.f(x) = x2 + 8x + 21
A. Two x-intercepts B. One x-intercept C. No x-intercepts
Solve the problem.It has been found that the less income people have, the more likely they are to report that their health is fair or poor. The function 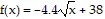 models the percentage of Americans reporting fair or poor health, f(x), in terms of annual income, x, in thousands of dollars. Find and interpret f(31).
A. f(31) ? 13.5; 13.5% of Americans earning $31 thousand annually report fair or poor health. B. f(31) ? 14.6; 14.6% of Americans earning $31 thousand annually report fair or poor health. C. f(31) ? $14.6; 31% of Americans earning $14.6 thousand annually report fair or poor health. D. f(31) ? 13.5; 31% of Americans earning $13.5 thousand annually report fair or poor health.