The graph of a function f is given. Use the graph to answer the question.For what numbers x is f(x) < 0?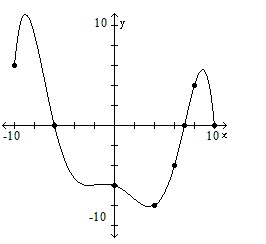
A. (-6, ?)
B. [-10, -6), (7, 10)
C. (-6, 7)
D. (-?, -6)
Answer: C
You might also like to view...
Answer the question(s) based on the following situation: Over the last 80 years records have been kept of the annual rainfall in the Tasmanian desert. The distribution of annual rainfall is approximately normal and has no outliers. The minimum of 4.5 inches of rain occurred in 1952; the maximum of 11.7 inches of rain occurred in 1934.The third quartile of the rainfall distribution is approximately
A. 7.3 inches. B. 8.1 inches. C. 8.9 inches. D. 7 inches. E. none of these
Name one figure that satisfies each set of properties. There may be more than one correct answer
It has four sides. Diagonals form two congruent triangles. Diagonals bisect each other. Both pairs of opposite sides are parallel.
Determine whether the statement is true or false.-16 < 11 + 20
A. True B. False
Indicate whether the graph of the equation is a parabola, circle, ellipse, or hyperbola.x2 = 144 + 9y2
A. ellipse B. hyperbola C. parabola D. circle