Use the graph of the function f(x) to locate the local extrema and identify the intervals where the function is concave up and concave down.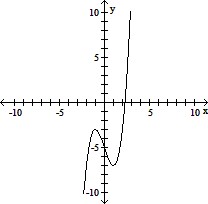
A. Local minimum at x = 1; local maximum at x =-1; concave down on (0, ?); concave up on (-?, 0)
B. Local maximum at x = 1; local minimum at x =-1; concave up on (0, ?); concave down on (-?, 0)
C. Local maximum at x = 1; local minimum at x =-1; concave up on (-?, ?)
D. Local minimum at x = 1; local maximum at x =-1; concave up on (0, ?); concave down on (-?, 0)
Answer: D
Mathematics
You might also like to view...
Write as a percent.
A. 20.0% B. 285.7% C. 2.9% D. 28.6%
Mathematics
Find the difference.8 - 8
A. 1 B. -8 C. 0 D. 8
Mathematics
Divide and reduce to lowest terms. ÷
÷ 
A. 
B. 
C. - 
D. 
Mathematics
Factor by any method.25z4 + 5z2 - 12
A. (5z4 + 4)(5z - 3) B. (5z2 + 4)(5z2 - 3) C. (5z2 + 3)(5z2 - 4) D. (5z4 + 3)(5z - 4)
Mathematics