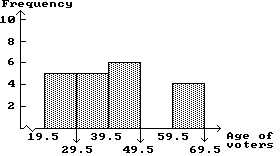
Construct the specified histogram.In a survey, 20 voters were asked their age. The results are summarized in the frequency table below. Construct a histogram corresponding to the frequency table. 
What will be an ideal response?
Mathematics
You might also like to view...
Find the limit using 
 = 1.
= 1.

A. 4/5 B. 5/4 C. 0 D. Does not exist
Mathematics
Solve.The population of a small country increases according to the function  where t is measured in years. How many people will the country have after 10 years?
A. 994,850 B. 3,729,562 C. 2,290,727 D. 6,279,716
Mathematics
Express the graph shown using interval notation. Also express it as an inequality involving x.![]()
A. (-?, -2) x < -2 B. [-2, ?) x ? -2 C. (-2, ?) x > -2 D. (-?, -2] x ? -2
Mathematics
Solve using the quadratic formula. Use a calculator to approximate the solution to three decimal places. x2 = -
  x +
x + 
A. -1 B. 1.5, -1 C. -1.5, 1 D. -1.5
Mathematics