The marginal product of labor (measured in units of output) of a firm is given by MPN = A(2000 - N)
where A measures productivity and N is the number of labor hours used in production. Suppose the price of output is $6 per unit and A = 0.002.
(a) What will be the demand for labor if the nominal wage is $18?
(b) What will be the demand for labor if the nominal wage rises to $21?
(a) The real wage = $18/$6 = 3. Setting the real wage equal to the marginal product of labor gives 3 = 0.002(2000 - N), so 0.002N = 1, so N = 500.
(b) The real wage = $21/$6 = 3.5. Setting the real wage equal to the marginal product of labor gives 3.5 = 0.002(2000 - N), so 0.002N = 0.5, so N = 250.
You might also like to view...
Use the following diagram to answer the next question.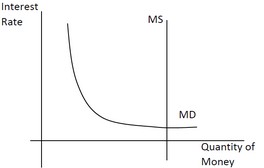 Based on this diagram, we can say ________.
A. monetary policy is likely to be more effective at fighting a recession than fiscal policy B. investment demand is very sensitive to changes in the interest rate C. an increase in the money supply will have little effect on investment or aggregate demand D. expansionary monetary policy will be more effective at increasing aggregate supply than aggregate demand
Which of the following is not correct?
a. When developing economic theories, graphs offer a way to visually express ideas that might be less clear if described with equations or words. b. Graphs are one way of expressing the relationships among variables. c. When studying the relationship between two economic variables, graphs allow economists to draw indisputable conclusions about causes and effects. d. When analyzing economic data, graphs provide a powerful way of finding and interpreting patterns.
Recall the Application about the decrease in price of illegal drugs in the United States to answer the following question(s).Recall the Application. If the decrease in price of illegal drugs is due to equal changes in demand and supply, the equilibrium quantity of drugs:
A. will increase. B. will decrease. C. will not change. D. may or may not change.
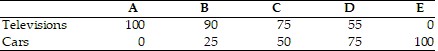 The above table shows the daily production possibilities for a nation. When the economy moves from point A to B in the above table, the opportunity cost of a televison in terms of cars is
A. 2. B. 0.5. C. 2.5. D. 10.