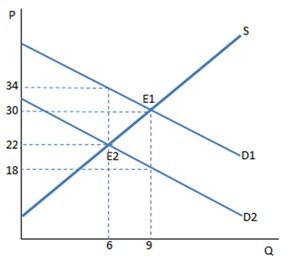
 The graph shown demonstrates a tax on buyers. How many fewer units are being sold due to the imposition of a tax on this market?
A. 12
B. 9
C. 3
D. 6
Answer: C
You might also like to view...
Refer to Scenario 4 . What is the maximum number of schools that can be built? The maximum number of prisons?
What will be an ideal response?
Refer to Figure 4-9. What is the size of the unit tax?
A) $8 B) $5 C) $3 D) cannot be determined from the figure
Give 4 examples of situations that would cause the DD-curve to shift to the left
What will be an ideal response?
Which of the following policies would be most likely to encourage households to save more?
a. Significant reductions in the social safety net b. Increasing social security benefits to all recipients, regardless of their contribution into the system c. Elimination of the tax deduction on individual retirement account (IRA) contributions d. Replacement of sales and excise taxes with an income tax e. Elimination of government insurance of bank deposits