What does the upper half of the diagram represent—the part marked 1?
a. the product market
b. the factor market
c. the government flow of resources
d. the flow of income
Ans: a. the product market
You might also like to view...
Which of the following will not result in a rightward shift of the market supply curve for labor?
a. an increase in immigration b. an increase in labor productivity c. an increase in the working-age population d. a decrease in nonwage income
The airline industry is best classified? as:
A) an oligopoly.
B) a monopoly.
C) perfectly competitive.
D) monopolistically competitive
Which of the following statements is true of income inequality in the U.S. economy?
A) Inequality in the U.S. economy had increased throughout the 20th century. B) Inequality in the U.S. economy had decreased throughout the 20th century. C) Inequality in the U.S. economy is now less than what it was in the year 1950. D) Inequality in the U.S. economy is now higher than what it was in the year 1950.
Answer the following statements true (T) or false (F)
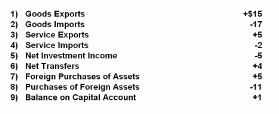
1) Refer to the given data. In 2008 Transylvania realized a $1 billion surplus on goods and services.
2) Refer to the given data. In 2008 Transylvania was a net recipient of transfers from the rest of the world.
3) Refer to the given data. Foreigners made a larger volume of asset purchases in Transylvania in 2008 than Transylvanians made asset purchases abroad.
4) Refer to the given data. Transylvania realized a financial and capital account deficit in 2008.
5) R