In the above, which figure shows a line with a slope of 1.0?
A) Figure A
B) Figure B
C) both Figure A and Figure B
D) neither Figure A nor Figure B
A
You might also like to view...
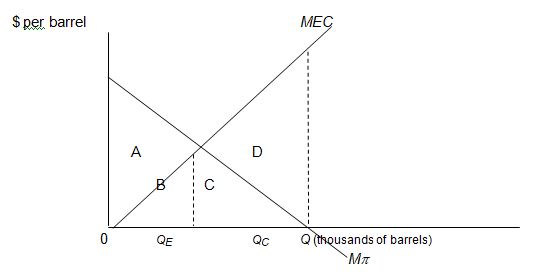
Which area represents the net gain to society? Should the reduction in output from QC to QE take place? Why or why not?
Use the following graph of the refined petroleum market to answer the questions below.
Elasticity measures
A) the slope of a demand curve. B) the inverse of the slope of a demand curve. C) the percentage change in one variable in response to a one percent increase in another variable. D) sensitivity of price to a change in quantity.
The administrative burden of taxes is:
A. smallest with a lump-sum tax. B. the same if the revenue generated is the same for any kind of tax. C. smaller the larger the amount of the tax. D. the same across all types of taxes.
Payments to households not in exchange for goods and services currently produced are:
A. transfer payments. B. government purchases. C. consumption expenditures. D. investment expenditures.