Use the graph of the function f(x) to locate the local extrema and identify the intervals where the function is concave up and concave down.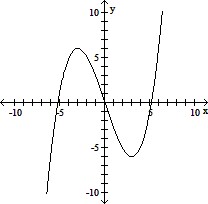
A. Local minimum at x = 3; local maximum at x = -3 ; concave up on (0, -3) and (3, ?); concave down on (-3, 3)
B. Local minimum at x = 3; local maximum at x = -3 ; concave up on (0, ?); concave down on (-?, 0)
C. Local maximum at x = 3; local minimum at x = -3 ; concave up on (0, -3) and (3, ?); concave down on (-3, 3)
D. Local minimum at x = 3; local maximum at x = -3 ; concave down on (0, ?); concave up on (-?, 0)
Answer: B
You might also like to view...
Fill in the blank with one of the words or phrases listed below. The solution(s) to the equation x + 5 = x + 4 is/are
  .
.
A. unlike terms B. no solution C. all real numbers D. reversed
Change the logarithmic expression to an equivalent expression involving an exponent.ln x = 6
A. x6 = e B. e6 = x C. ex = 6 D. 6e = x
Refer to the graph of the linear function defined by  or the graph of the linear functions defined by
  and
and  to solve the equation or inequality.
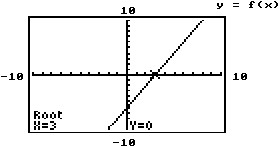 f(x) ? 0
A. (-?, -6] B. [3, ?) C. (-?, 3] D. [-6, ?)
Solve the equation by multiplying both sides by the LCD. =
= 
A. 
B. 
C. 
D. 